Windows 10 Pro(CPU only)
Python 3.6.8
環境構築
- MXNetとGluonTSのインストール
pip install mxnet
pip install gluonts
- FBProphetのインストール
詳細はこちらを参照
pip install Cython
pip install pystan==2.17.1
pip install fbprophet
pip install plotly
- 最終的なパッケージの確認(pip freeze)
alabaster==0.7.12
Babel==2.7.0
boto3==1.9.248
botocore==1.12.248
certifi==2019.9.11
chardet==3.0.4
colorama==0.4.1
convertdate==2.1.3
cycler==0.10.0
Cython==0.29.13
dataclasses==0.6
docutils==0.15.2
ephem==3.7.7.0
fbprophet==0.5
gluonts==0.0.0
graphviz==0.8.4
holidays==0.9.11
idna==2.6
imagesize==1.1.0
Jinja2==2.10.3
jmespath==0.9.4
kiwisolver==1.1.0
lunardate==0.2.0
MarkupSafe==1.1.1
matplotlib==3.1.1
mxnet==1.6.0b20191004
numpy==1.16.5
packaging==19.2
pandas==0.25.1
plotly==4.1.1
pydantic==0.28
Pygments==2.4.2
pyparsing==2.4.2
pystan==2.17.1.0
python-dateutil==2.8.0
pytz==2019.3
requests==2.18.4
retrying==1.3.3
s3transfer==0.2.1
setuptools-git==1.2
six==1.12.0
snowballstemmer==2.0.0
Sphinx==1.7.9
sphinxcontrib-websupport==1.1.2
tqdm==4.36.1
ujson==1.35
urllib3==1.22
今回試すこと
1年前までの株価のデータからその先1年の株価を予測してみた。
予測するために過去2年間のデータ(24回分のデータ)を使用するモデルとした。
データのダウンロード
日経平均プロフィルのダウンロードセンターから月次データをダウンロードする。
ダウンロードセンター - 日経平均プロフィル
(日次データは土日祝日のデータがなく等間隔の時系列データになっていないため月次データを使用した)
サンプルコード
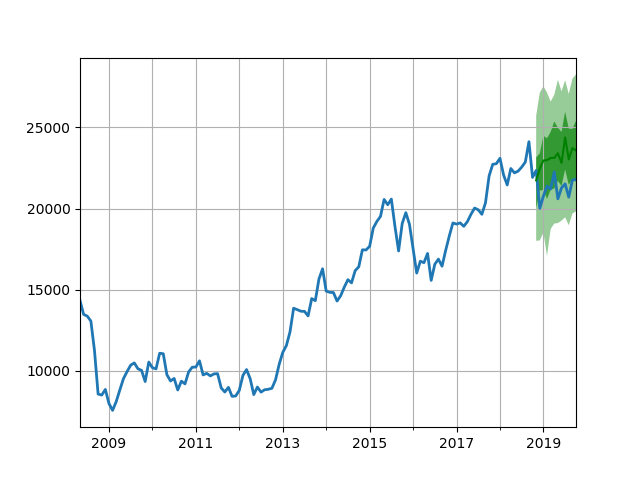
- DeepAR
import pandas as pd

df = pd.read_csv('nikkei.csv',index_col=0)
#直近1年分のデータ(12個のデータ)は訓練データに含めない
df_all = df[['value']]
df_train = df[['value']][:-12]

from gluonts.dataset.common import ListDataset
training_data = ListDataset(
    [{"start": df_train.index[0], "target": df_train.value}],
    freq = "1M")

test_data = ListDataset(
    [{"start": df_all.index[0], "target": df_all.value}],
    freq = "1M")

from gluonts.model.deepar import DeepAREstimator
from gluonts.trainer import Trainer
#次の prediction_length 値を、先行して与えられた context_length 値から予測
estimator = DeepAREstimator(freq="1M",
                            prediction_length=12,
                            context_length=24,
                            trainer=Trainer(epochs=30))
predictor = estimator.train(training_data=training_data)

from matplotlib import pyplot as plt
from gluonts.dataset.util import to_pandas
for real_value, forecast in zip(test_data, predictor.predict(training_data)):
    to_pandas(real_value)[100:].plot(linewidth=2)
    forecast.plot(color='g', prediction_intervals=[50.0, 90.0])
    plt.grid(which='both')

plt.show()
- FBProphet
「pd.plotting.register_matplotlib_converters()」の位置が重要!!
import pandas as pd

df = pd.read_csv('nikkei.csv',index_col=0)
#直近1年分のデータ(12個のデータ)は訓練データに含めない
df_all = df[['value']]
df_train = df[['value']][:-12]

from gluonts.dataset.common import ListDataset
training_data = ListDataset(
    [{"start": df_train.index[0], "target": df_train.value}],
    freq = "1M")

test_data = ListDataset(
    [{"start": df_all.index[0], "target": df_all.value}],
    freq = "1M")

from gluonts.model.prophet import ProphetPredictor
predictor = ProphetPredictor("1M", 12)

pd.plotting.register_matplotlib_converters()
from matplotlib import pyplot as plt
from gluonts.dataset.util import to_pandas

for real_value, forecast in zip(test_data, predictor.predict(training_data)):
    to_pandas(real_value)[100:].plot(linewidth=2)
    forecast.plot(color='g', prediction_intervals=[50.0, 90.0])
    plt.grid(which='both')

plt.show()
結果
- DeepAR
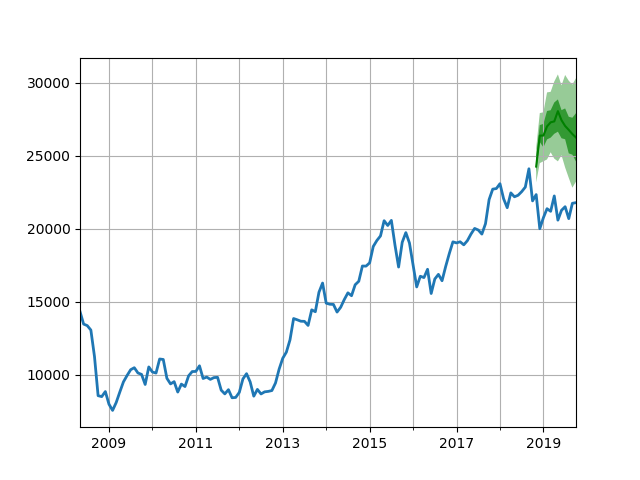
- FBProphet