はじめに
「MXNet」信者の私にとってGluonTSがMXNetなしで動くのは悲報です。TSは「Time Series」の略です。GluonTSは時系列データを扱うツールになります。一部のモデルに限りますがPyTorchでGluonTSが利用できました。MXNetのインストールは必要ありません。環境
「Windows 11」と「Ubuntu 20.04 on WSL2」の二つで動作確認しています。Python 3.8.10 gluonts==0.8.1 torch==1.10.0+cu113 pytorch-lightning==1.5.3
Pythonスクリプト
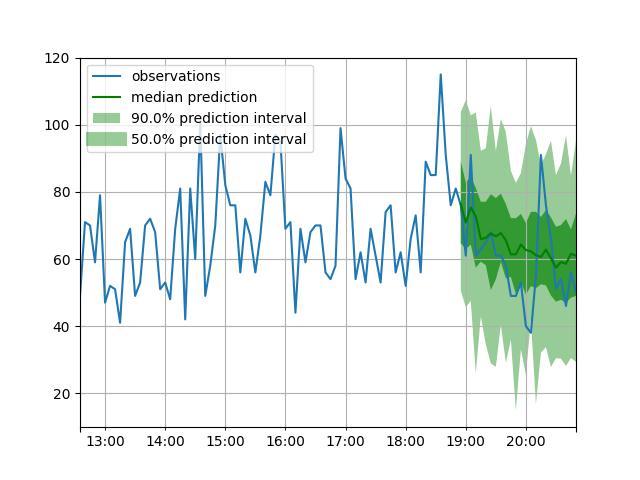
import warnings
warnings.simplefilter('ignore')

from gluonts.dataset.common import ListDataset
from gluonts.dataset.util import to_pandas
from gluonts.torch.model.deepar import DeepAREstimator
from gluonts.evaluation.backtest import make_evaluation_predictions

import pandas as pd
from matplotlib import pyplot as plt
url = "https://raw.githubusercontent.com/numenta/NAB/master/data/realTweets/Twitter_volume_AMZN.csv"
df = pd.read_csv(url, header=0, index_col=0)

train_data = ListDataset([{
    "start": df.index[0],
    "target": df.value[:-24]
    }],
    freq="5min")

test_data = ListDataset([{
    "start": df.index[0],
    "target": df.value
    }],
    freq="5min")

estimator = DeepAREstimator(
    freq='5min',
    prediction_length=24,
    trainer_kwargs=dict(max_epochs=3),
)

predictor = estimator.train(train_data)

forecast_it, ts_it = make_evaluation_predictions(
    dataset=test_data,
    predictor=predictor,
    num_samples=100
)

plot_length = 100
prediction_intervals = (50.0, 90.0)
legend = ["observations", "median prediction"] + [f"{k}% prediction interval" for k in prediction_intervals][::-1]

for x, y in zip(test_data, forecast_it):
    to_pandas(x)[-plot_length:].plot()
    y.plot(color='g', prediction_intervals=prediction_intervals)
    plt.grid(which='both')
    plt.legend(legend, loc='upper left')

plt.show()
結果
関連記事
touch-sp.hatenablog.comtouch-sp.hatenablog.com
さいごに
こうやってみんな「MXNet」を要らないものにしていくんですね。さみしい限りです。