はじめに
データは標準ディジタル画像データベース(DICOM版) | 日本放射線技術学会 画像部会から『Nodule154images (806MB)』をダウンロードさせて頂きました。
Shiraishi J, Katsuragawa S, Ikezoe J, Matsumoto T, Kobayashi T, Komatsu K, Matsui M, Fujita H, Kodera Y, and Doi K.: Development of a digital image database for chest radiographs with and without a lung nodule: Receiver operating characteristic analysis of radiologists’ detection of pulmonary nodules. AJR 174; 71-74, 2000
データは12bitグレースケールですが今回は8bitに落としてJPEGで保存しました。それによって情報の一部は失われてしまいます。
「pydicom」を使用しましたがpipを使って簡単にインストールできました。
JPEGに変換するPythonスクリプト
import pydicom
from PIL import Image
import os
import glob

all_path = glob.glob('./Nodule154images/*.dcm')

os.mkdir('nodule')

for path in all_path:

    file_name = os.path.splitext(os.path.basename(path))[0]

    a = pydicom.read_file(path)

    b = a.pixel_array

    e = Image.fromarray((b/16).astype('uint8'), mode = 'L')

    e.save(os.path.join('nodule', '%s.jpg'%file_name)
病変を表示するPythonスクリプト
DICOMファイルと同時に臨床情報のテキストファイルもダウンロードさせて頂きました。(アカウントの作成が必要です。)from PIL import Image, ImageDraw import numpy as np import os import pandas as pd data = pd.read_csv('CLNDAT_EN.TXT', sep='\t', header=None) i = 2 file_name = os.path.splitext(data.iloc[i,0])[0] + '.jpg' position_x = data.iloc[i,5] position_y = data.iloc[i,6] size = data.iloc[i,2] nodule_size = size/0.175 half_width = int(nodule_size/2) img = Image.open(os.path.join('nodule', file_name)) draw = ImageDraw.Draw(img) draw.rectangle((position_x - half_width, position_y - half_width, position_x + half_width, position_y + half_width), outline=255, width=3) img.show()
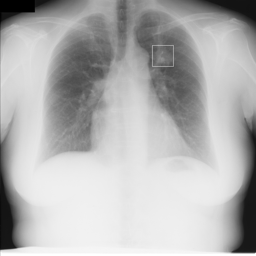
病変部位が四角で囲われています。
GluonCVのplot_bboxを使う場合は以下のようになります。
import os
import pandas as pd
import numpy as np
from matplotlib import pyplot as plt
from mxnet import image
from gluoncv.utils.viz import plot_bbox

data = pd.read_csv('CLNDAT_EN.TXT', sep='\t', header=None)

i = 2

file_name = os.path.splitext(data.iloc[i,0])[0] + '.jpg'
img = image.imread(os.path.join('nodule', file_name))

position_x = data.iloc[i,5]
position_y = data.iloc[i,6]
size = data.iloc[i,2]
nodule_size = size/0.175
half_width = int(nodule_size/2)

x_min = position_x - half_width
x_max = position_x + half_width

y_min = position_y - half_width
y_max = position_y + half_width

bounding_boxes = np.array([x_min, y_min, x_max, y_max]).reshape(1,-1)
class_ids = np.zeros(shape=(1,))

plot_bbox(img, bounding_boxes, scores=None, labels=class_ids, class_names=['nodule'])

plt.axis("off")
plt.show()
